Plot a map with rivers in R
R is a great tool to make maps including maps with rivers. I would like to share how I created a map with rivers in R using the simplest code possible.
I recently needed to create a map for a publication where we study fish species. So, showing sampling locations on a map with rivers was a requirement. An obvious solution for that was of course to use R. And although making a map with rivers in R turned out to be easy, I spent half the day searching for a solution.
I use R to create maps for all my publications. It is a free, simple, and precise way to plot points on a nice-looking map. If I need to add more things to the map, I save it in SVG format and edit it in Inkscape, an open-source editor for vector graphics.
Make a map plot in R
In my view, the best way to create maps and plot sampling locations in R is to use the maps library. It produces clean and informative maps.
Usually, I would use the code like the one below.
library(maps)
library(rworldmap) # to plot axes

newmap <- getMap(resolution = "hight")

lat1 <- runif(5,  35, 55)
long1 <- runif(5,  0, 50)
lat2 <- runif(5,  35, 55)
long2 <- runif(5,  0, 50)

svg("map_Europe.svg", height=4, width=6)
par(mar=c(3, 3, 2, 2))
waterColor <- 'cadetblue1'
plot(newmap, xlim = c(0, 50), ylim = c(35, 70),
     asp = 1,lty=2, lwd=1,
     bg=waterColor, col="#ffffff", main = "Europe")
map.axes()
points(x=long1, y=lat1, pch= 15, col="black", cex=1.2)
points(x=long2, y=lat2, pch= 17, col="red", cex=1.2)
legend("topright", bg="white", pt.cex = 1.2,
       legend = c('group1', 'group2'), col=c('black', 'red'), pch = c(15, 17))
dev.off()
It produces a map of Europe with random points representing two tentative groups.
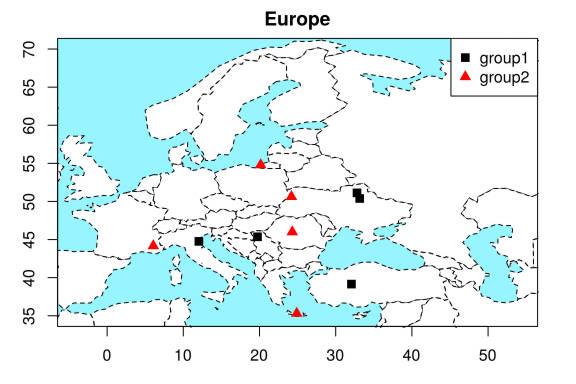
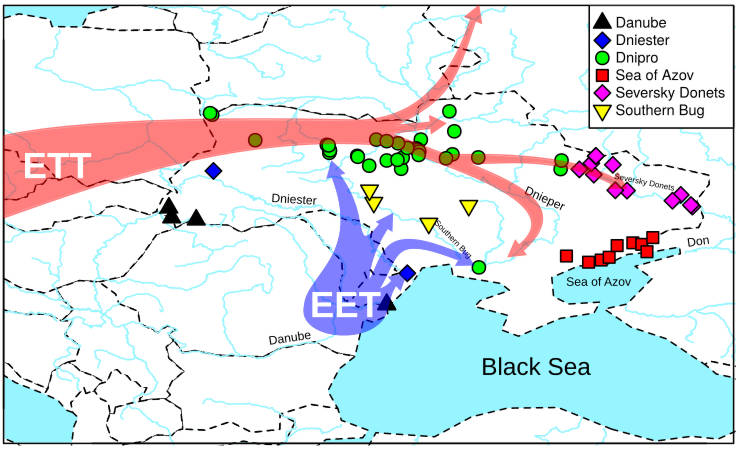
You can modify this code to make any map you need by providing your coordinates of the points and changing colors, lines, etc. For example, I used this code with some post-editing in Inkscape to create a map for our recent publication in PLOS Genetics.
Add rivers to a map in R
I liked this map style and I did not want to change it. I only needed to add rivers to this map. However, the online search often provided totally different ways to make maps including ggmap and ggplot2 libraries. This was not what I wanted.
I will not list all the options I tried but believe me I tried many. In the end, the most optimal solution was to find a shapefile of needed rivers and add them to the map.
I needed a river map of Europe. There are many shapefiles of European water systems online. I tried the top 10 files I found in Google and I liked the most the one published on this website.
I download the Europe_Hydrography.rar file, extracted it, loaded it to R and added rivers to my previous map with this code:
library(rgdal)
riversData <- readOGR("Europe_Hydrography") # load the shapefile
plot(riversData, col=waterColor, add=T) # plot rivers
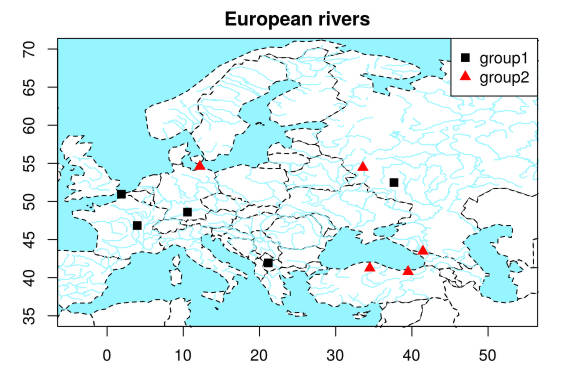
This is the map of Europe with rivers I obtained.
Code to make a map with rivers in R
Here is the whole code to make this rivers map of Europe.
library(maps)
library(rworldmap) # to plot axes
library(rgdal) # to load the shapefile

newmap <- getMap(resolution = "hight")
riversData <- readOGR("Europe_Hydrography") # load the shapefile

lat1 <- runif(5,  35, 55)
long1 <- runif(5,  0, 50)
lat2 <- runif(5,  35, 55)
long2 <- runif(5,  0, 50)

svg("map_Europe.svg", height=4, width=6)
par(mar=c(3, 3, 2, 2))
waterColor <- 'cadetblue1'
plot(newmap, xlim = c(0, 50), ylim = c(35, 70),
     asp = 1,lty=2, lwd=1,
     bg=waterColor, col="#ffffff",
     main = "Europe")
plot(riversData, col=waterColor, add=T) # plot rivers
map.axes()
points(x=long1, y=lat1, pch= 15, col="black", cex=1.2)
points(x=long2, y=lat2, pch= 17, col="red", cex=1.2)
legend("topright", bg="white", pt.cex = 1.2,
       legend = c('group1', 'group2'), col=c('black', 'red'), pch = c(15, 17))
dev.off()
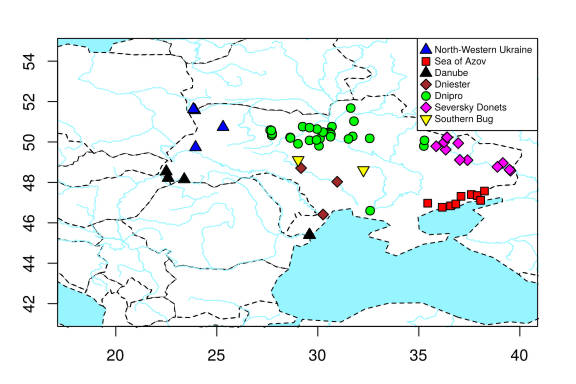
Actually, this is the code I used with some modification to make the rivers map with sampling locations for our upcoming publication. I also added the names of major rivers and migration arrows using Inkscape. You have seen the final image at the top of this post.
Conclusion
R is proven to be a universal tool for making great scientific illustrations for free. Making a map with rivers is R is also simple and effective. You only need to find the right shapefile of rivers you want to plot. Moreover, you can use shapefiles of any other geospatial objects (roads, mountains, climate data, etc) to add them to the map.
If you have any questions or suggestions, feel free to email me.