
R loops are slow: How to deal with that
You may have noticed that R loops are slow. You will find out why it is so and how to deal with that.
When you start learning R, no one will tell you that R loops are slow. At least, I was not taught about this and I have not seen an explicit statement about this in R textbooks. Later on, you begin using R beyond trivial tasks and you discover that R loops often becomes a bottleneck of your scripts. You would wonder why it is so and how to deal with that. This is exactly what happened to me.
Indeed, R for loops are inefficient, especially if you use them wrong. Searching for why R loops are slow discovers that many users are wondering about this question. Below, I summarize my experience and online discussions regarding this issue by providing some trivial code examples.
R is an interpreted language
This is what you need to keep in mind when you write in R or any other interpreted language. Make interpreted language easy for the end-user comes at the costs of processing such a code. There is a lot of extra computing steps to interpret the user-friendly code into computer code and execute it. That is why a compiled language is much faster as it doesn’t carry the extra baggage of interpreted language.
Does this mean you need to learn C or similar languages? Of course, not, though it won’t hurt to know some C :-). You just need to be aware of this fact and try to write your R code in a way that makes it efficient.
Below, I provide some examples that will help you understand when I am talking about. I also think these examples can be used as the best practices for R loops programming.
Keep R loops code minimal
Let’s have a look at the example when even some extra characters that do nothing impact the processing speed.
Create a matrix with random numbers:
set.seed(123)
m <- matrix(runif(1000000, max = 100), ncol = 100)
Calculate row means:
loopmean <- function(x){
  v <- c()
  for (i in c(1:dim(x)[1])){
    v[i] <- mean(x[i,])
  }
  return(v)
}

system.time(loopmeanD <- loopmean(m))
#  user  system elapsed
# 0.039   0.003   0.044
The function here doesn’t matter. I just picked up mean as the most trivial example. We are interested in the amount of time it takes to process this loop.
If we reuse the same code but add some extra brackets in mean(), it will take substantially longer to process:
loopmeanBrackets <- function(x){
  v <- c()
  for (i in c(1:dim(x)[1])){
    v[i] <- mean(((((((((((((((((x[i,])))))))))))))))))
  }
  return(v)
}

system.time(loopmeanBracketsD <- loopmeanBrackets(m))
#  user  system elapsed
# 0.051   0.000   0.050

identical(loopmeanD, loopmeanBracketsD)
# [1] TRUE
We have changed nothing in terms of math. It is still the same calculation as before. However, R needs to go through each ( and ) every loop cycle and this slows down the code a lot.
So, next time you write your loop, make it as minimal as possible in terms of character numbers.
Process by columns
R naturally process the data by columns faster than by row. If you need to loop through the columns, transform your data and loop through the columns:
loopmeanColumn <- function(x){
  v <- c()
  for (i in (1:dim(x)[2])){
    v[i] <- mean(x[,i])
  }
  return(v)
}

tm <- t(m)
system.time(loopmeanColumnD <- loopmeanColumn(tm))
#  user  system elapsed
# 0.037   0.000   0.036

identical(loopmeanD, loopmeanColumnD)
# [1] TRUE
Allocate memory
R also processes loops faster when you allocate the memory for the output object. In this case, R just needs to fill in the cells in a vector instead of extending the vector every loop cycle.
vertorloopmean <- function(x){
  v <- vector(length = dim(x)[1])
  for (i in c(1:dim(x)[1])){
    v[i] <- mean(x[i,])
  }
  return(v)
}

system.time(vertorloopmeanD <- vertorloopmean(m))
#  user  system elapsed
# 0.031   0.000   0.032

identical(loopmeanD, vertorloopmeanD)
# [1] TRUE
Use apply
When you search online why R loops are slow, you are likely to find the advice to use apply because it is faster. I also thought that apply is faster than for loops until I did the small research for this blog-post. In fact, apply also loops through the data and often it seems to be a little faster than for loops because its code tends to be shorter:
applymean <- function(x){
  v <- apply(m, 1, mean)
  return(v)
}

system.time(applymeanD <- apply(m, 1, mean))
#  user  system elapsed
# 0.035   0.004   0.038
identical(loopmeanD, applymeanD)
# [1] TRUE
Processing by columns is also fater for apply:
applymeanColumn <- function(x){
  v <- apply(tm, 2, mean)
  return(v)
}

system.time(applymeanColumnD <- applymeanColumn(m))
#  user  system elapsed
# 0.036   0.000   0.036
identical(loopmeanD, applymeanColumnD)
# [1] TRUE
Please, see the benchmarking of all loops below to get more details on how apply compares to for loops. In this case, it actually was not faster than the for loop.
Compile your functions
You can improve the performance of your function by compiling it to byte code. This is especially beneficial when your function code is long.
library(compiler)

loopmeanCompiled <- cmpfun(loopmean)

system.time(loopmeanCompiledD <- loopmeanCompiled(m))
#  user  system elapsed
# 0.035   0.000   0.035
identical(loopmeanD, loopmeanCompiledD)
# [1] TRUE
Parallelize
R has several libraries that allow parallelizing the processing between the core of your processor.
I usually use doParallel library for that. It is not beneficial in this mean example, because it takes longer to split the processes between cores and collect the results that to run everything on one core. However, when each loop cycle is long enough, parallelizing helps a lot.
library(doParallel)

registerDoParallel(cores=12)

system.time(loopParallelD <- foreach(i=1:dim(m)[1], .combine=c) %dopar% mean(m[i,]))
#  user  system elapsed
# 1.173   0.157   1.042
identical(loopmeanD, loopParallelD)
# [1] TRUE
Use Built-in functions
Everything described above helps only marginally. You can get some performance improvments with these tricks but you will neber beat the built-in R functions that call C code directly without interpretation step. Just look at how much faster is the built-in function to calculate row means:
system.time(rowMeanD <- rowMeans(m))
#  user  system elapsed
# 0.002   0.000   0.002
identical(loopmeanD, rowMeanD)
# [1] TRUE
So, before you write your function, make sure there is no R library with such function already.
Write in C++
There is also an option to write your code in C++ and compile it with Rcpp to R code. This will also result in a considerably faster code. But of course, you need to know some C++ for that.
#include <Rcpp.h>
using namespace Rcpp;

//[[Rcpp::export]]
NumericVector cRowMeans(NumericMatrix x) {
 int nrows = x.nrow();
 NumericVector v(nrows);
 for (int i = 0; i < nrows; i++){
   v[i] = mean(x.row(i));
 }
 return v;
}

system.time(cRowMeansD <- cRowMeans(m))
#  user  system elapsed
# 0.004   0.000   0.004
identical(loopmeanD, cRowMeansD)
# [1] TRUE
Benchmarking R loops
Using system.time() several times with the same function will produce little different results. Although the system.time presented above is comparable it does not fully reflect the reality. As I have mentioned above, only after benchmarking all these functions, I discovered that apply was not as fast as I expected. Moreover, in this particular code, it was slower than a simple for loop.
library(microbenchmark)

mbm <- microbenchmark("LoopRowExtraBrackets" = loopmeanBrackets(m),
                      "ApplyRow" = applymean(m),
                      "ApplyColumn" = applymeanColumn(tm),
                      "LoopRowCompiled" = loopmeanCompiled(m),
                      "LoopRow" = loopmean(m),
                      "LoopColumn" = loopmeanColumn(tm),
                      "LoopRowToVector" = vertorloopmean(m),
                      "CLoop"= cRowMeans(m),
                      "Built-in_rowMeans" = rowMeans(m),
                      check = 'equal', times=1000)

mbm
# Unit: milliseconds
#                 expr       min        lq      mean    median        uq       max neval  cld
# LoopRowExtraBrackets 44.693969 49.214291 53.174126 51.161645 53.941782 93.298477   100   d
#             ApplyRow 38.594932 44.356220 50.847681 46.949665 51.282932 88.668781   100   d
#          ApplyColumn 38.211502 44.035419 51.626075 47.071399 52.140827 94.046727   100   d
#              LoopRow 35.798877 40.832460 43.676707 42.363606 44.313524 80.957104   100   c
#      LoopRowCompiled 33.665563 40.451894 42.942701 42.355379 44.258304 73.966924   100   c
#           LoopColumn 34.566808 39.875668 42.668796 41.743636 44.099745 76.010563   100   c
#      LoopRowToVector 32.187435 37.927207 40.912034 39.813388 42.197814 74.008110   100   c
#             RowLoopC  2.794117  3.721194  5.664805  4.260946  6.525059 49.985055   100   b
#    Built-in_rowMeans  1.571780  1.668413  1.815267  1.687677  1.791447  3.601554   100   a
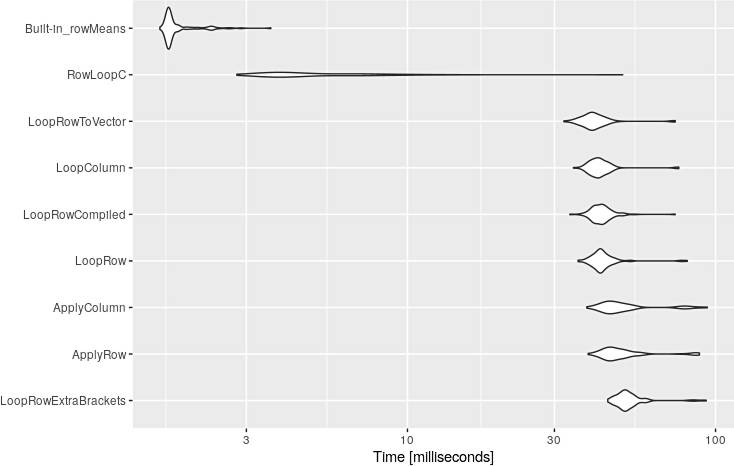
And the visualization of these results:
library(ggplot2)
autoplot(mbm)
Code
You can download the R code and test everything yourself.
Conclusion
We use R not because of its speed but rather because of its ease of use. The most efficient R code will never be faster than the alternative C code. But knowing the behavior of R I described above will help you to make your R loops the fastest within the limitation of R as an interpreted language.